
Visual Figure Gallery
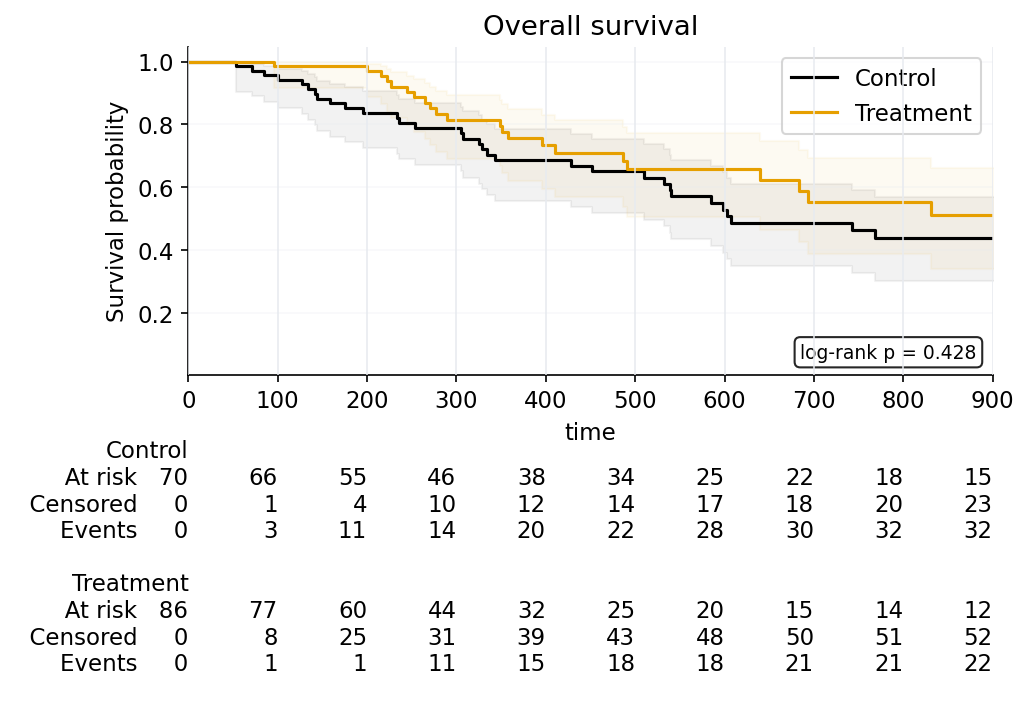
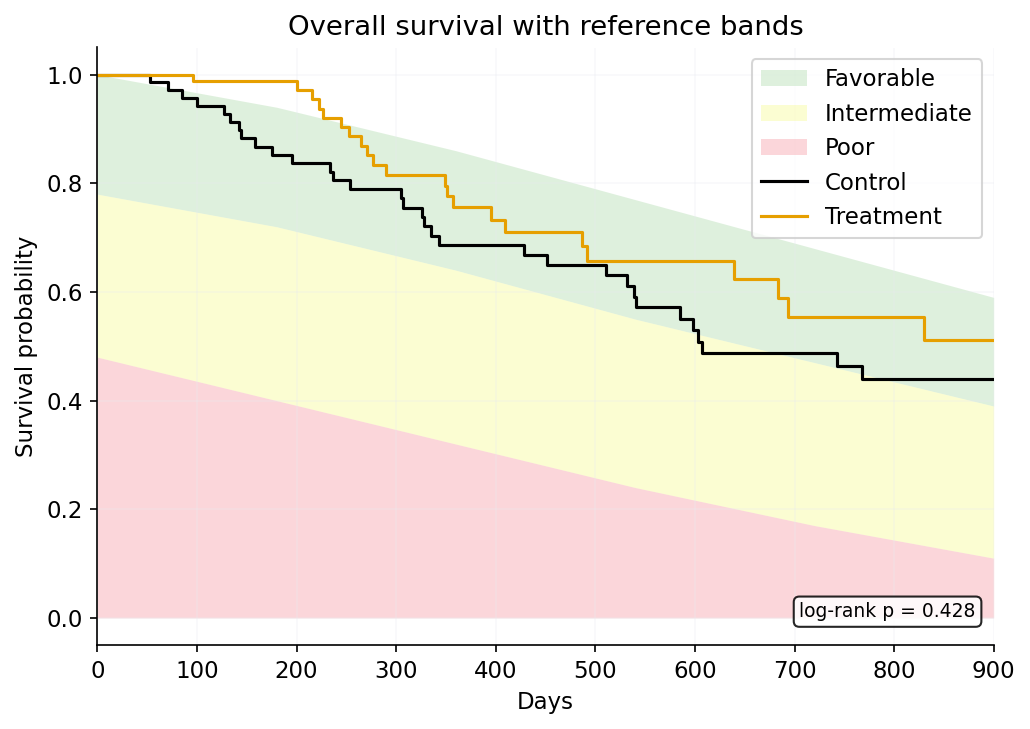
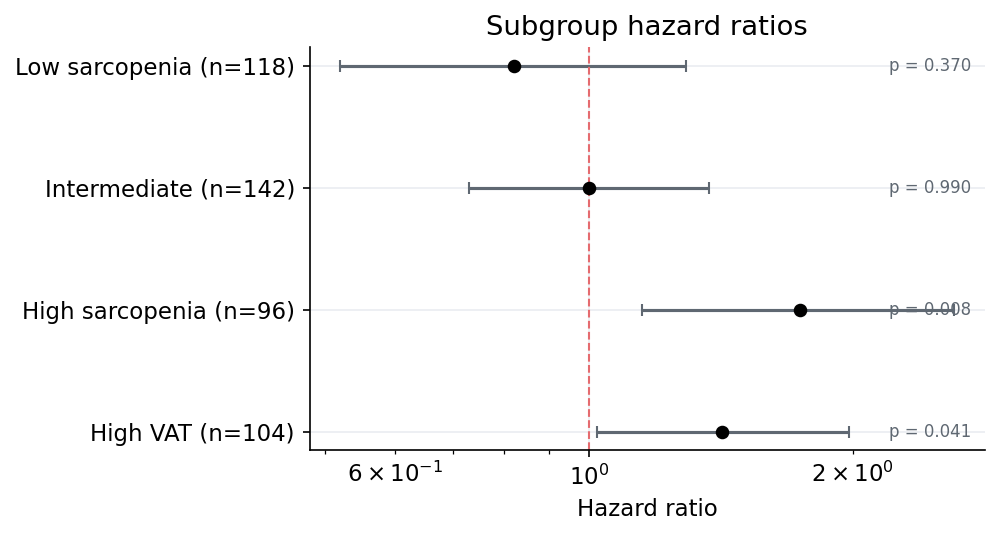
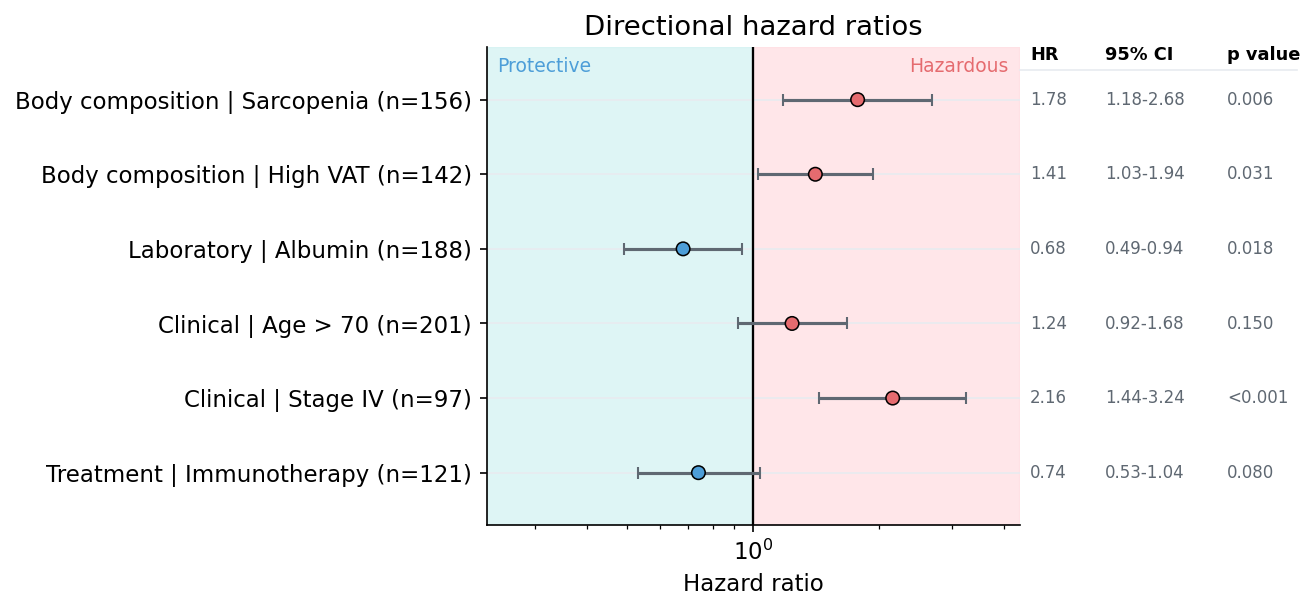
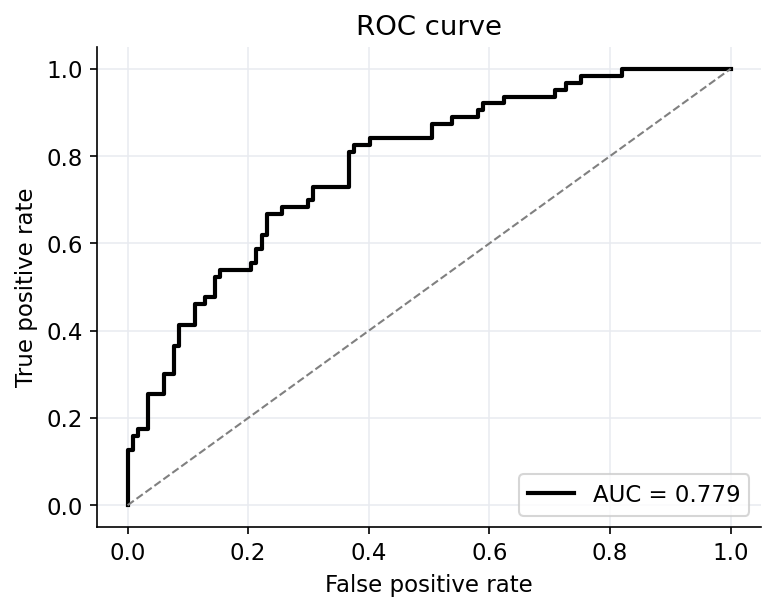
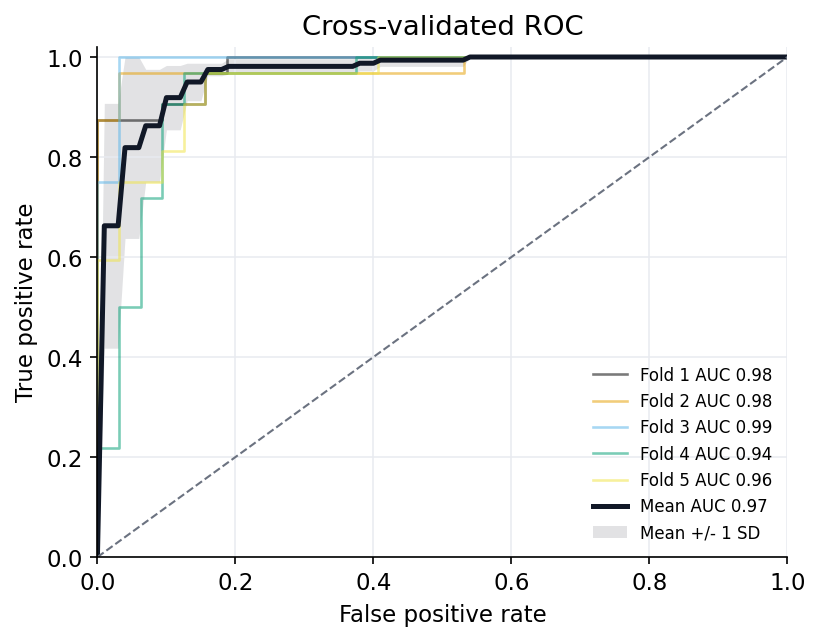
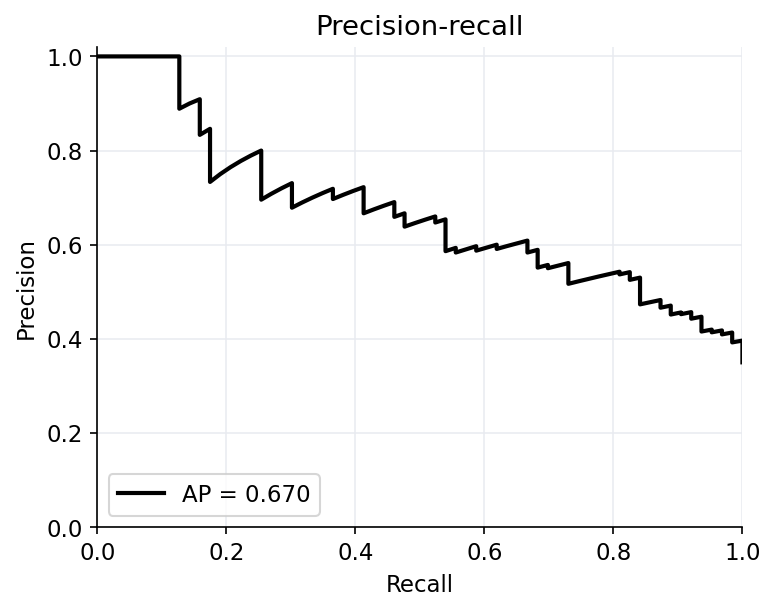
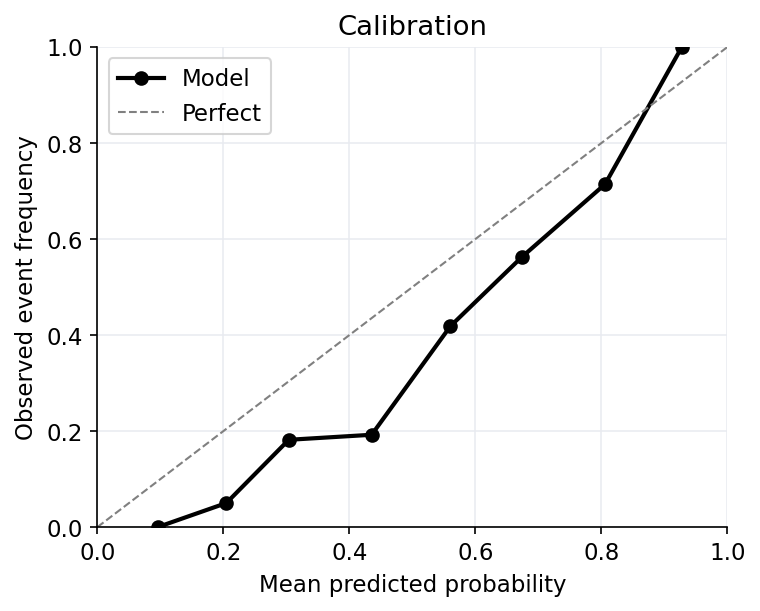
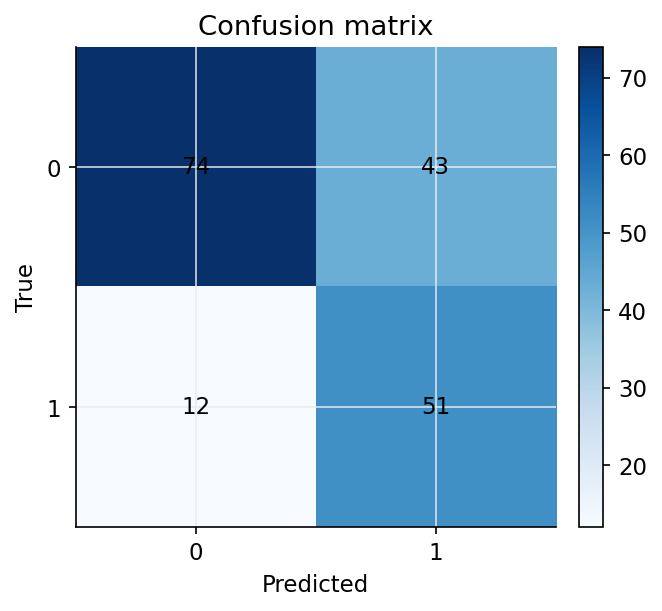
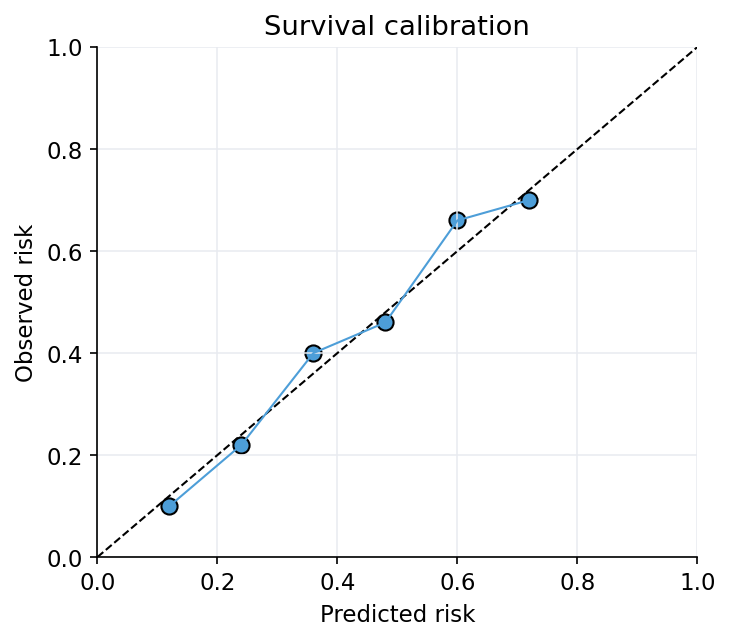
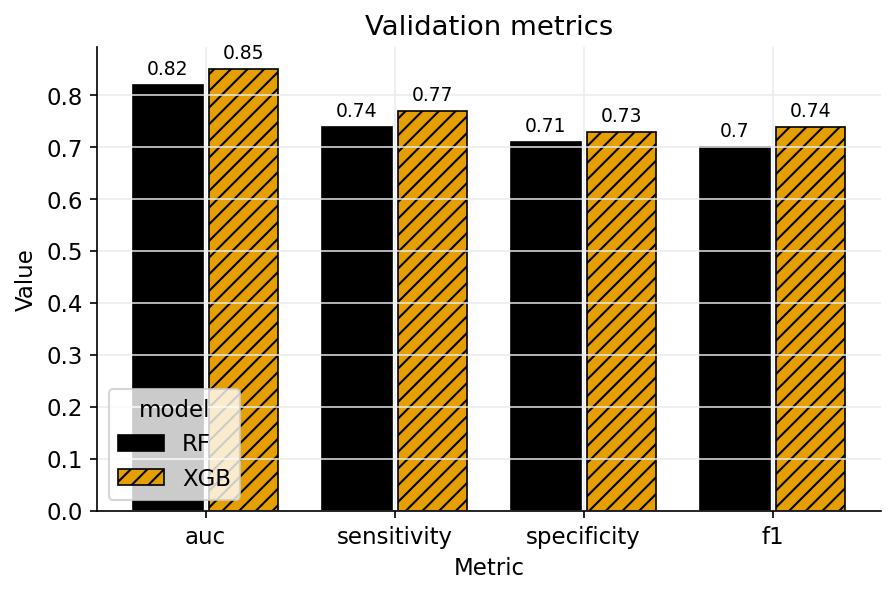
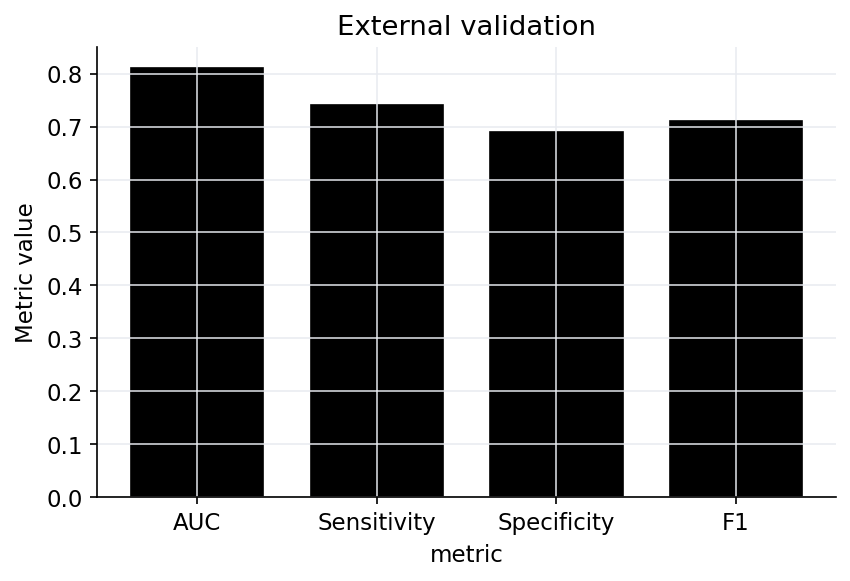
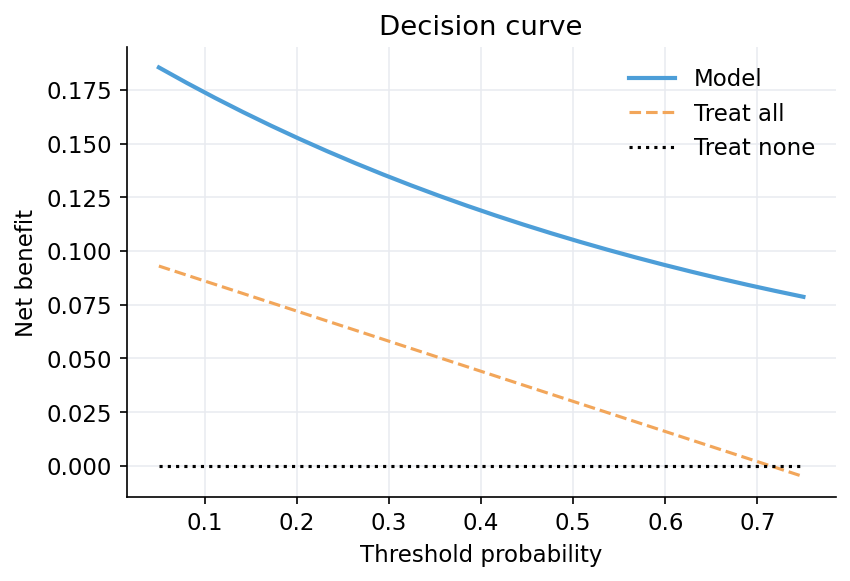
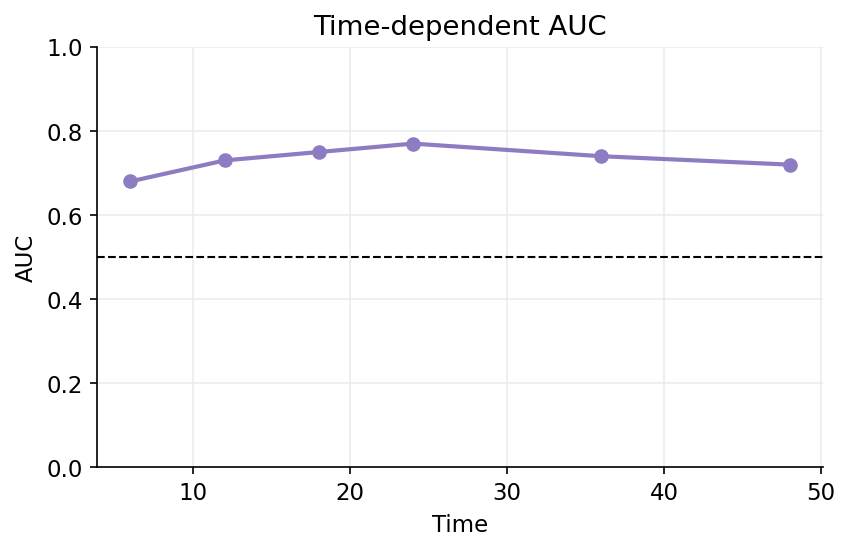
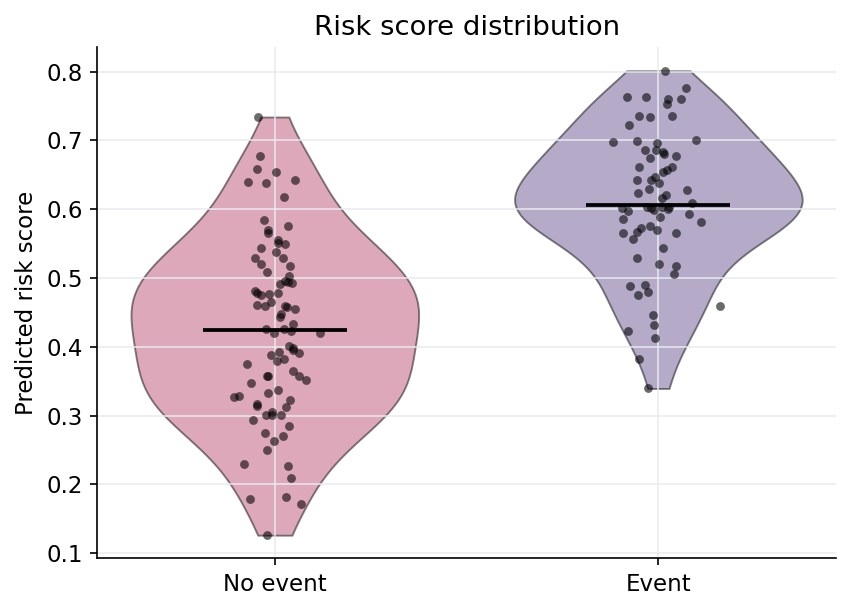
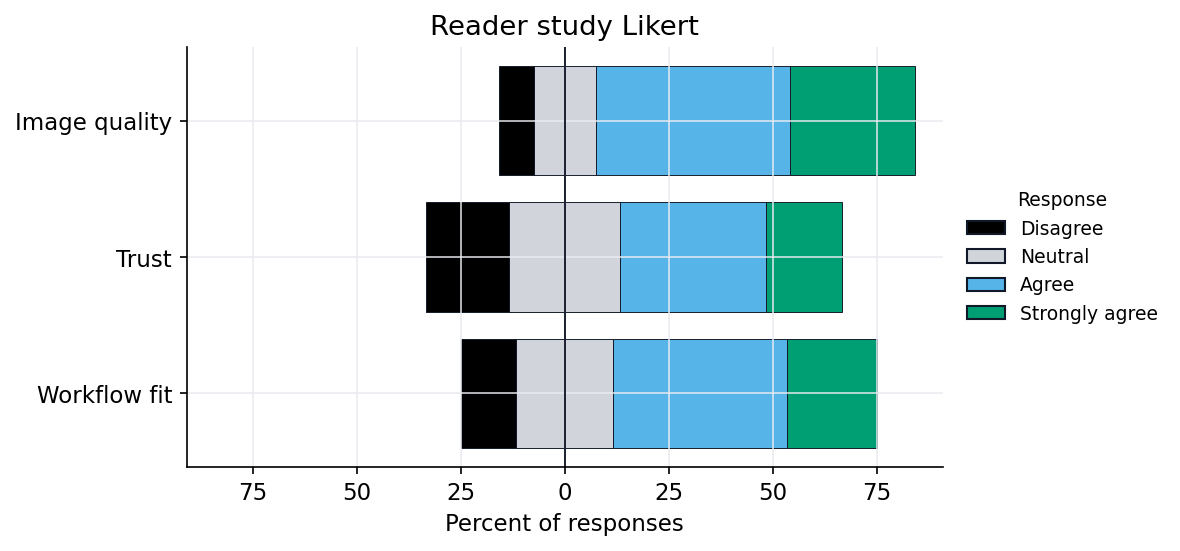
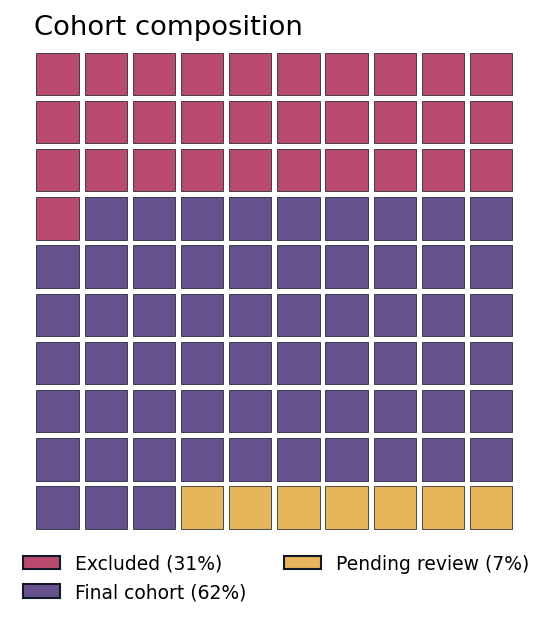
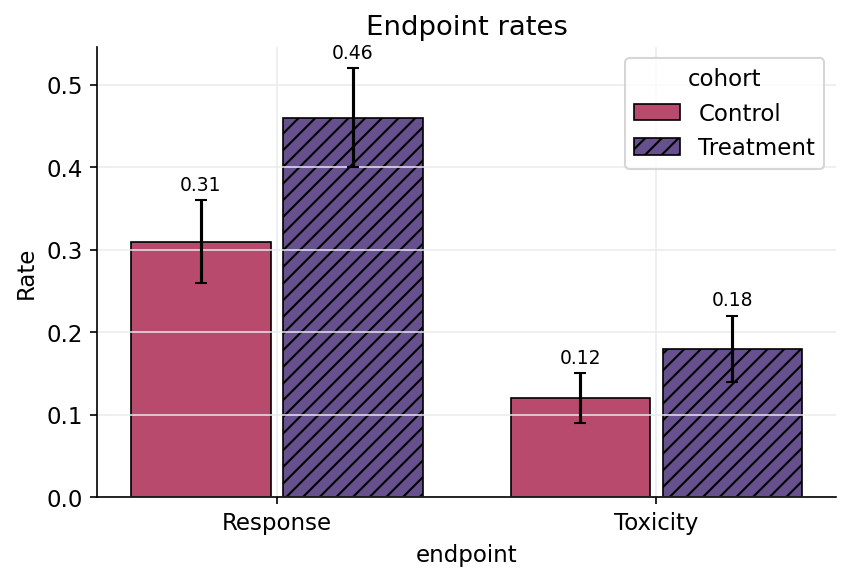
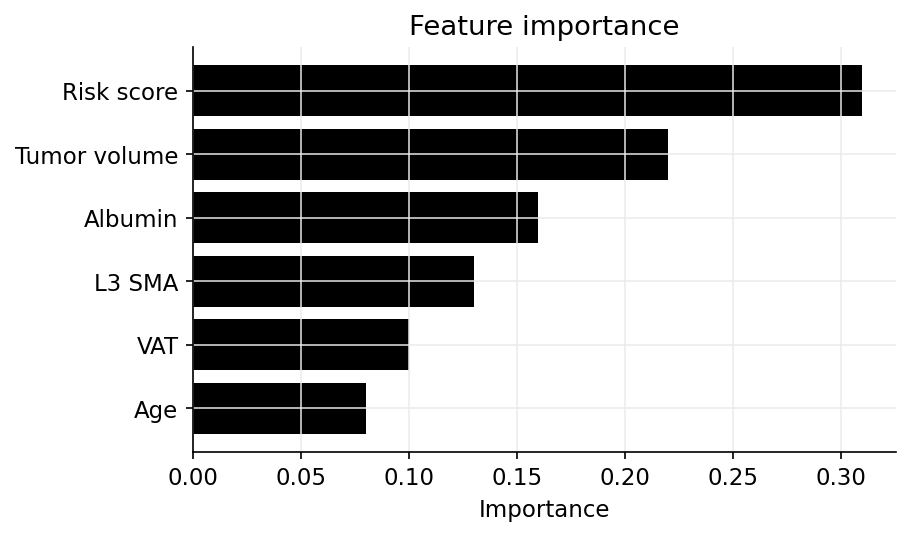
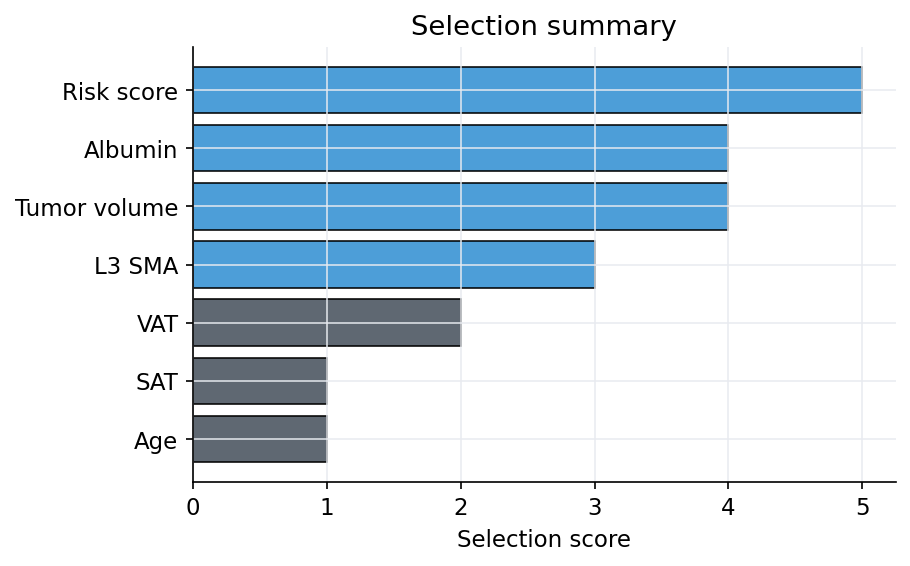
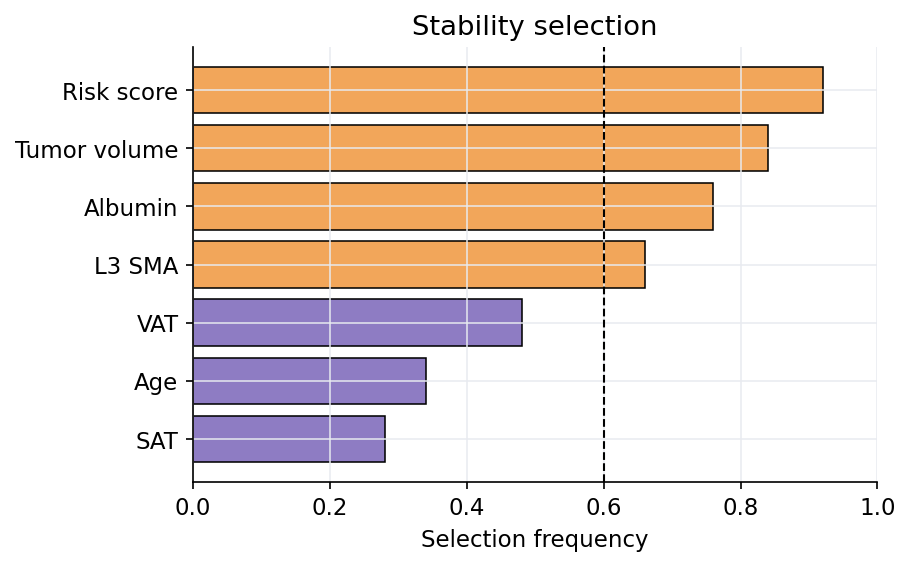
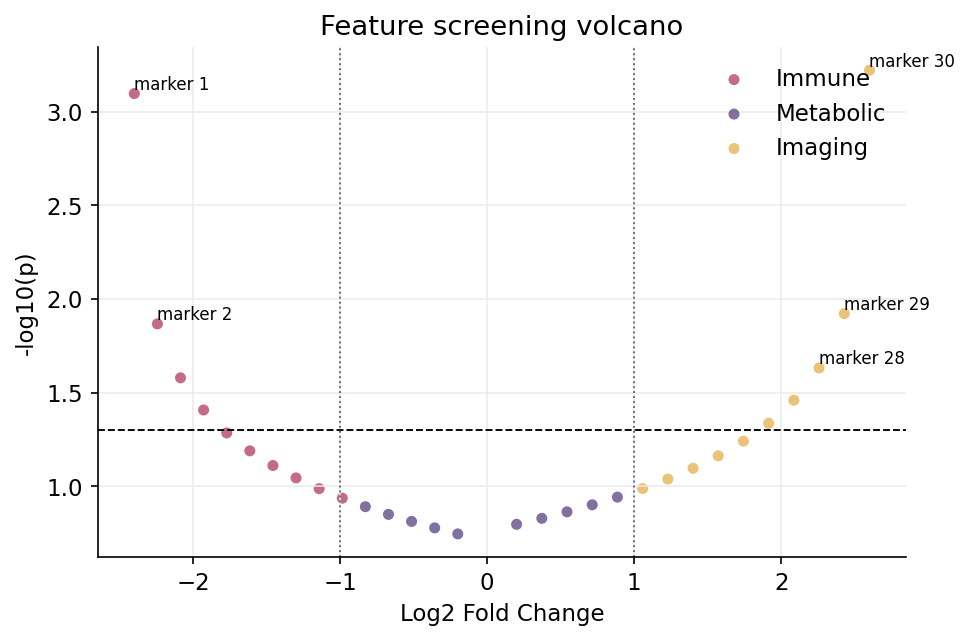
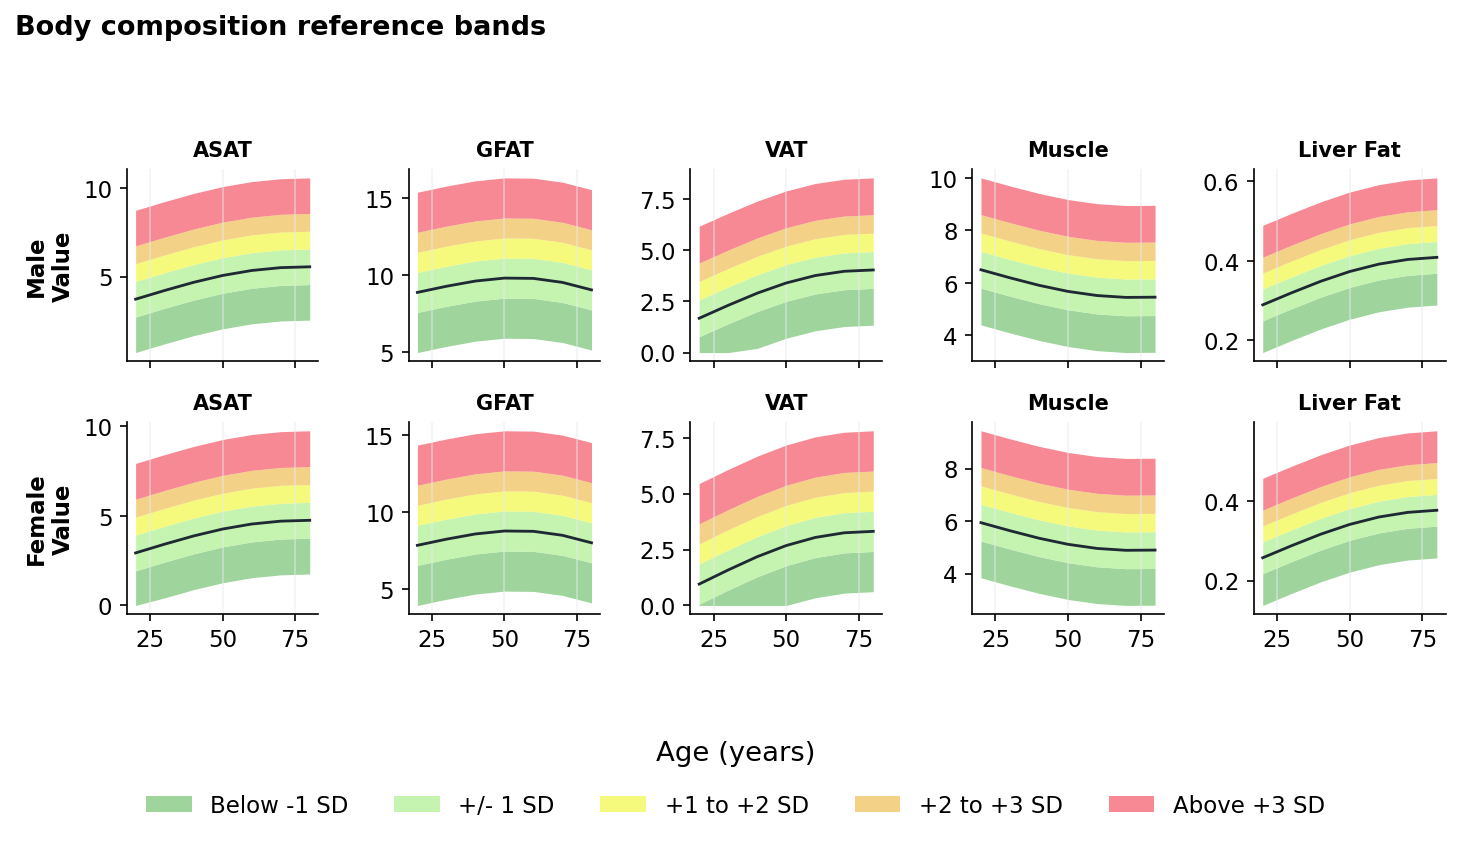
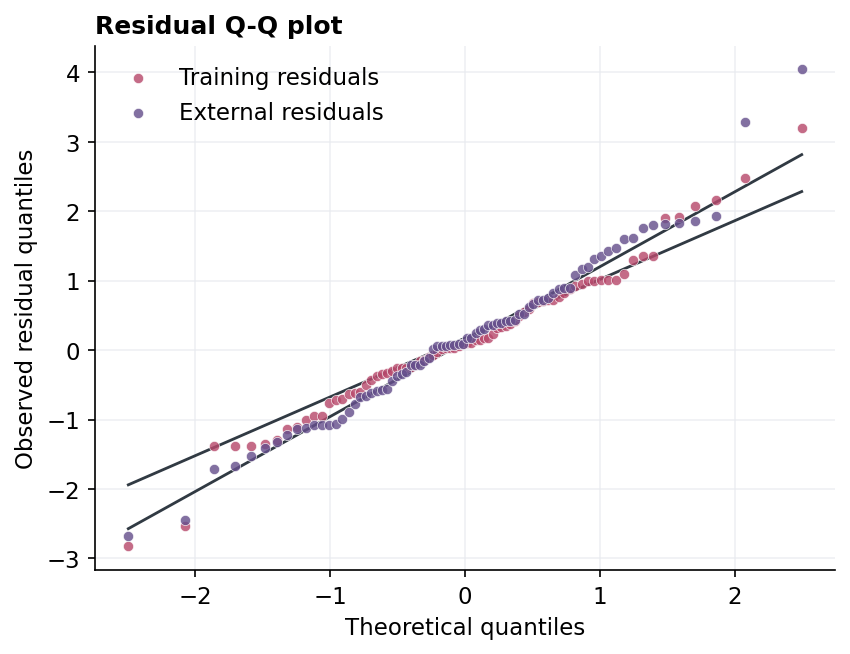
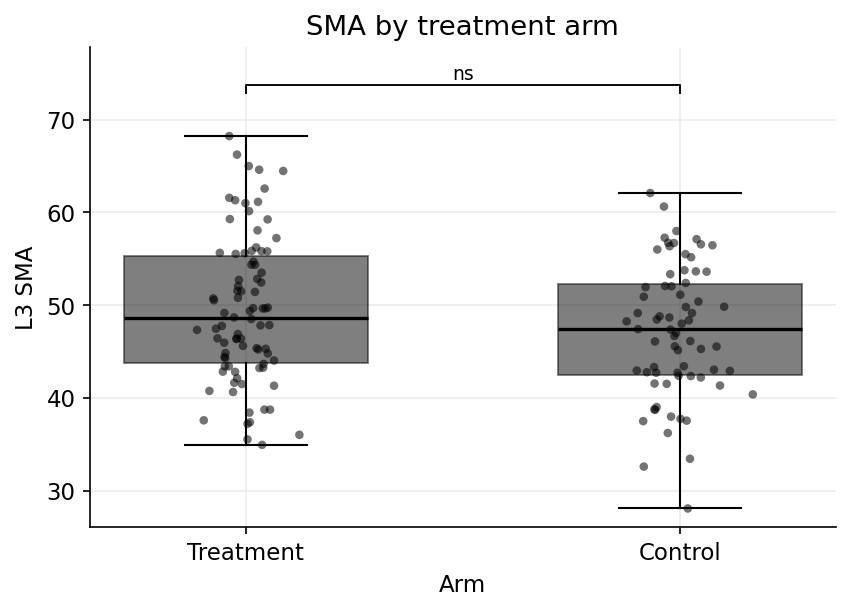
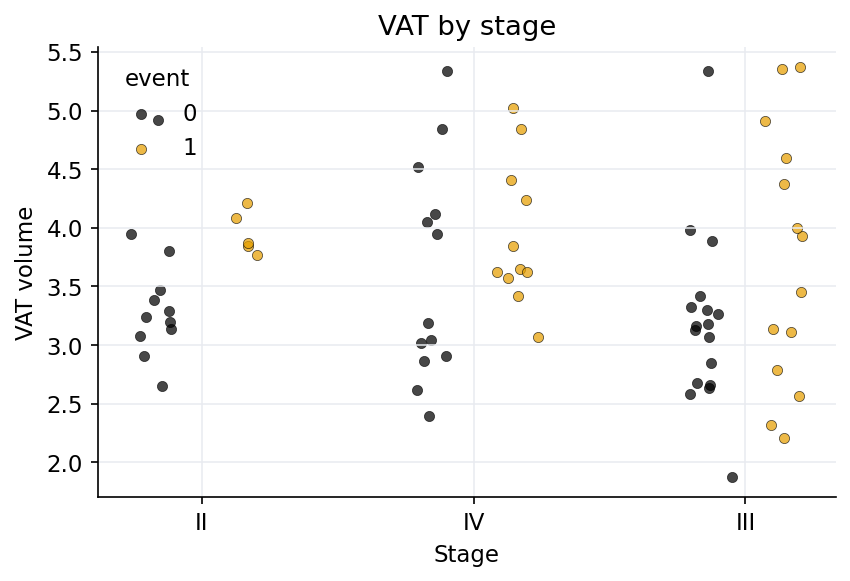
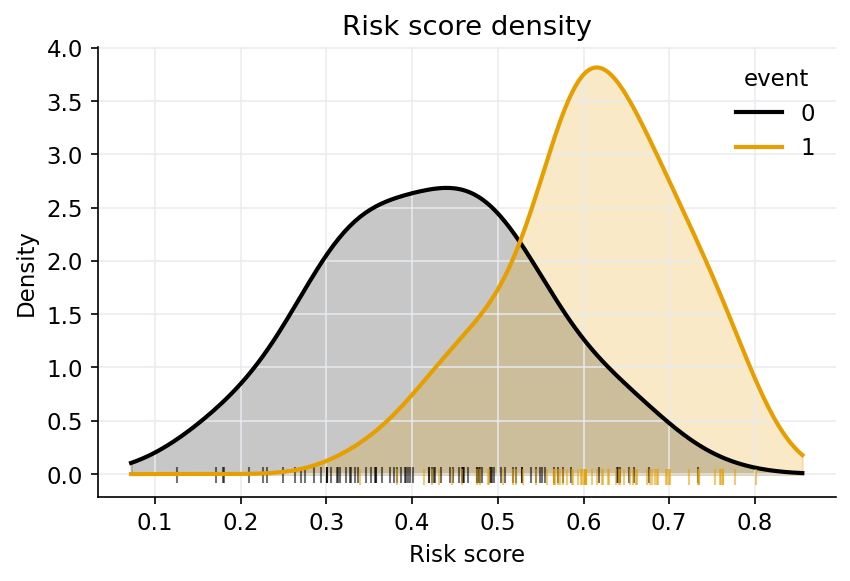
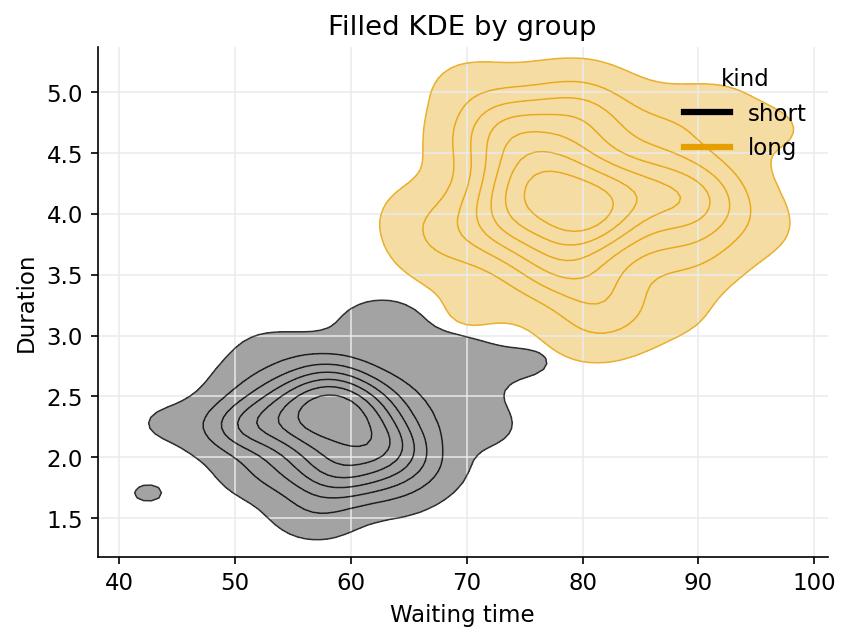
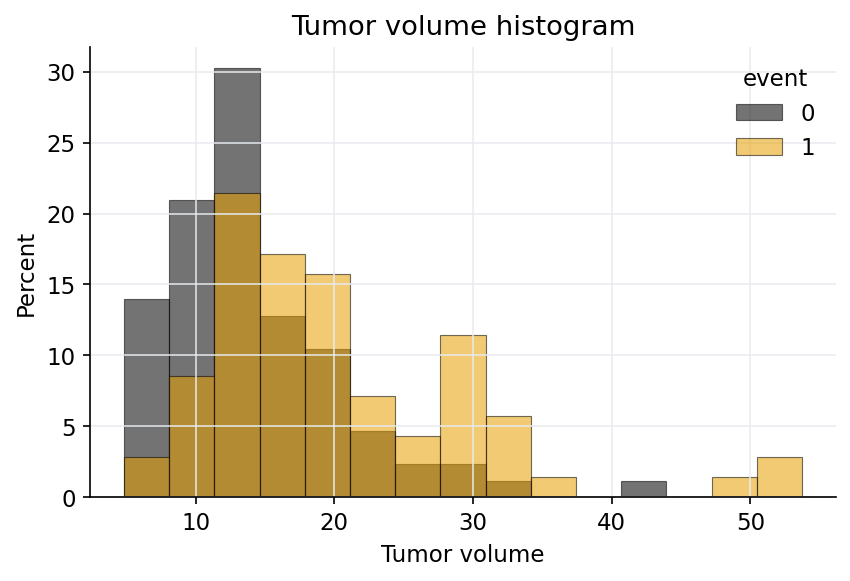
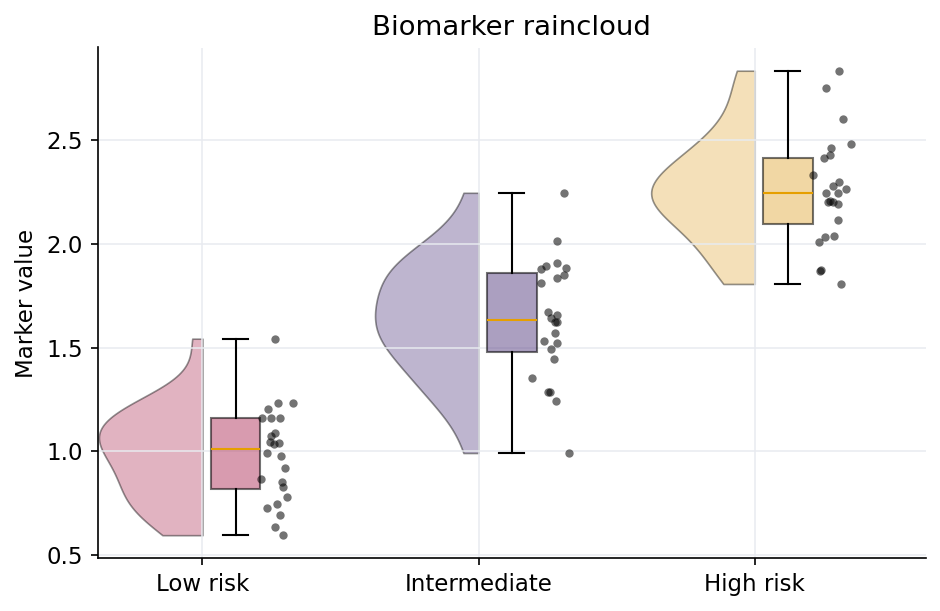
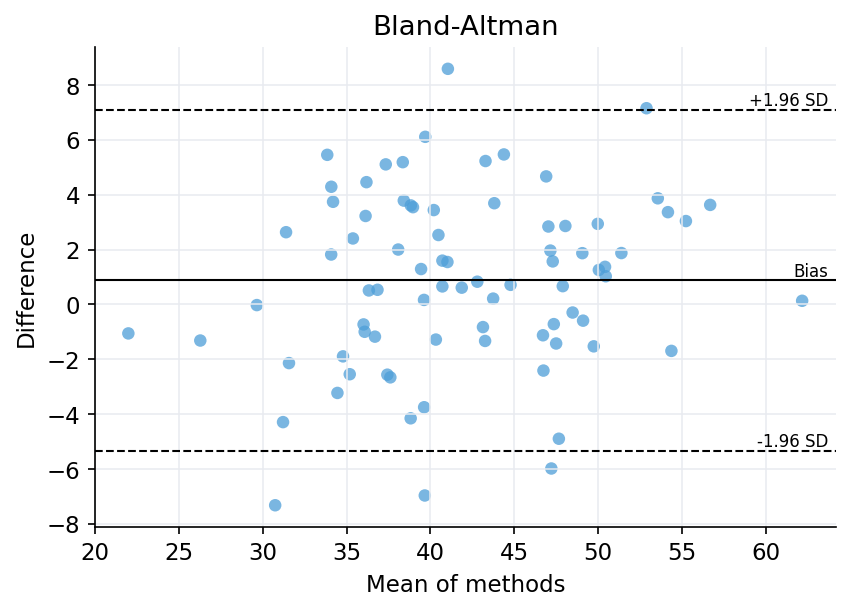
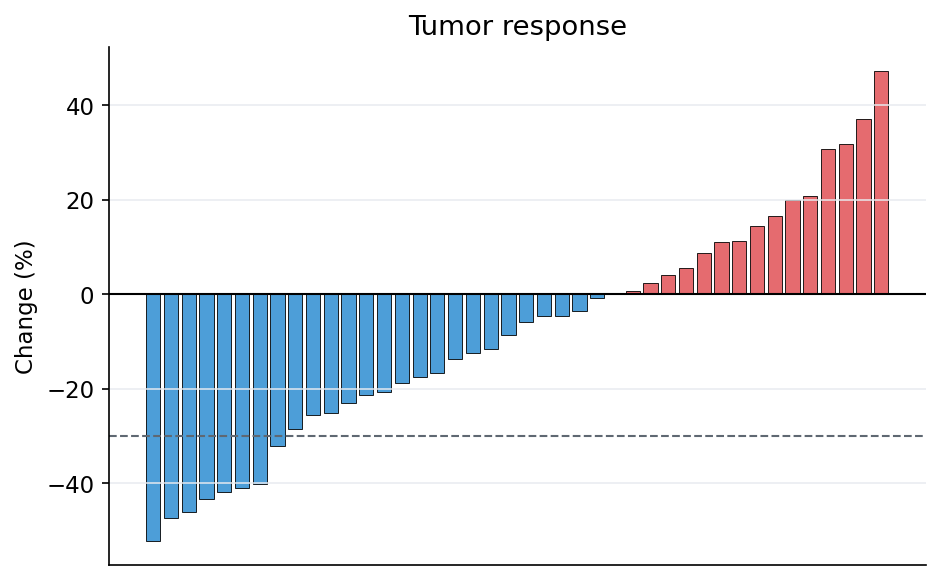
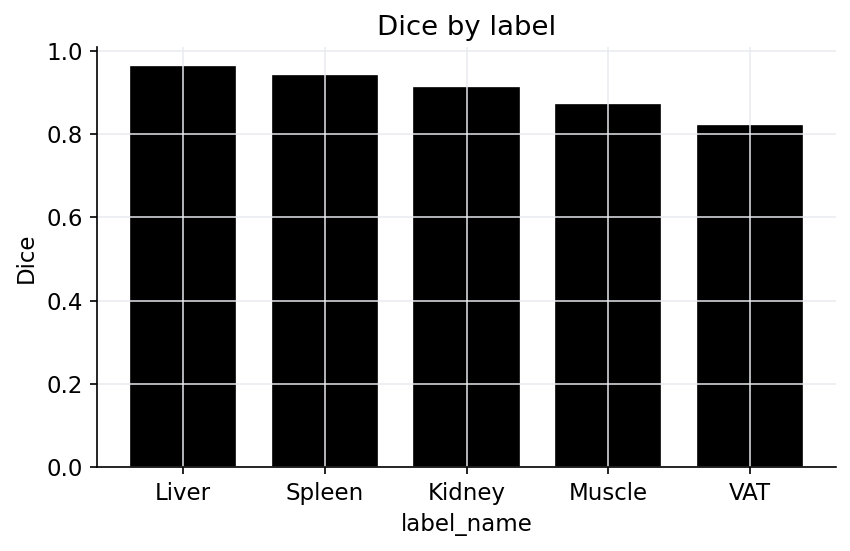
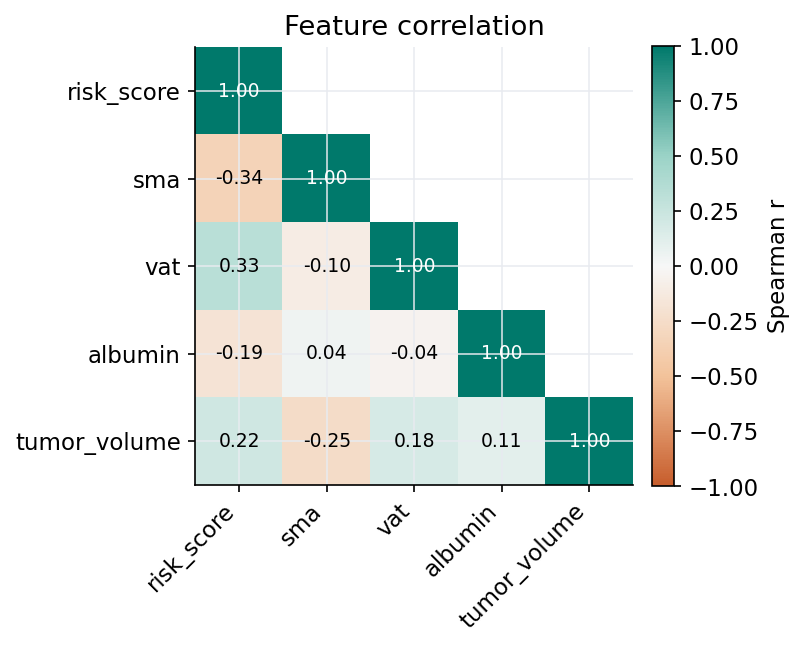
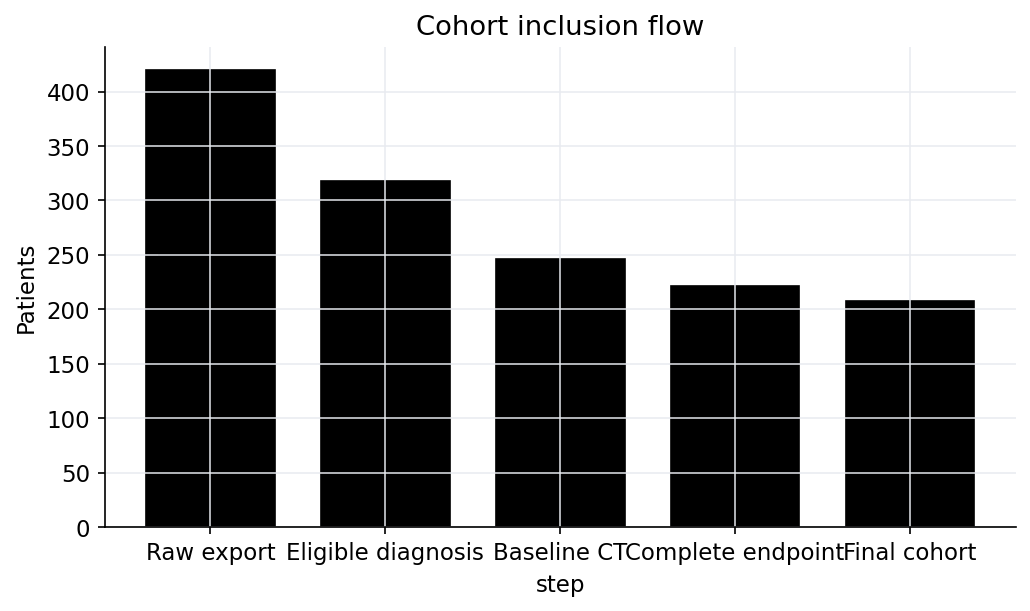
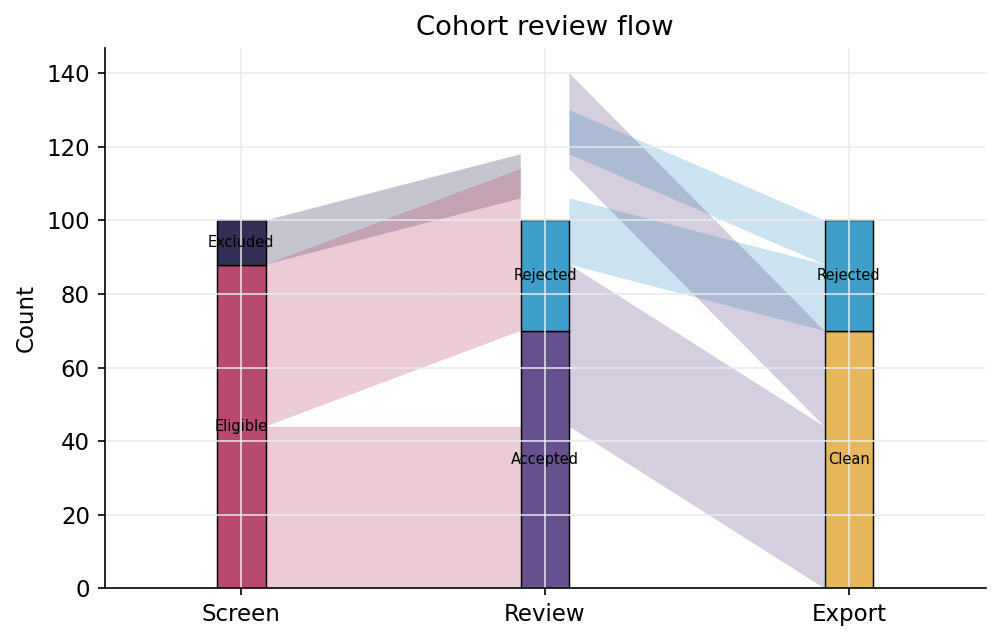
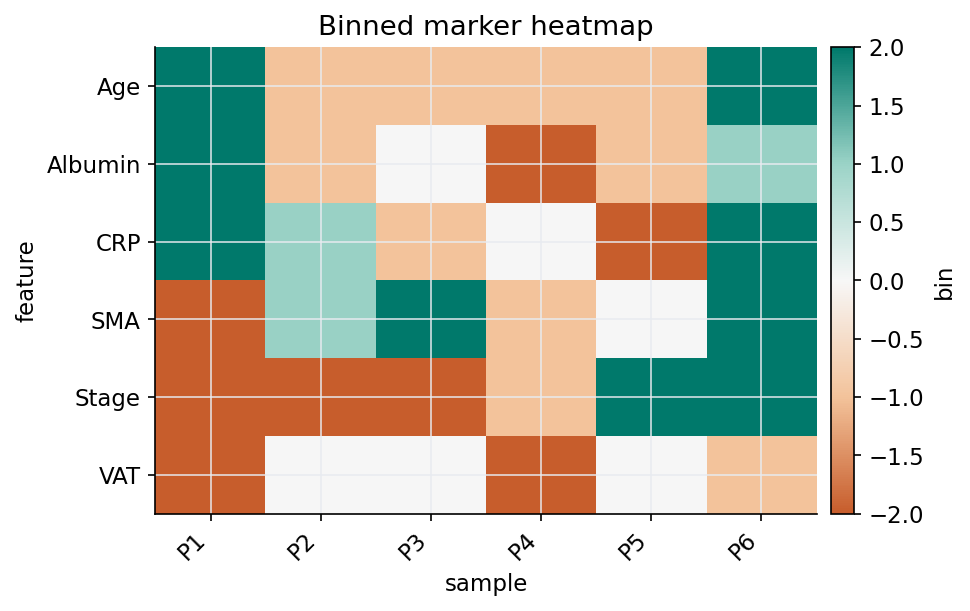
This page shows generated Fyron figure examples from synthetic data. The images demonstrate layout, annotation style, and manuscript-ready visual language; they are not clinical results.
Use this gallery to choose a plot family, then follow the linked module guide for parameters, return values, and export patterns.
Gallery Coverage
The gallery is representative, not exhaustive. It covers the main clinical plotting families and uses synthetic data only, so the images demonstrate layout and style rather than clinical results.
Survival
Model Discrimination
Calibration And Thresholds
Validation And Decision Curves
Risk And Endpoint Bars
Feature Selection And Importance
Distributions
Agreement And Response
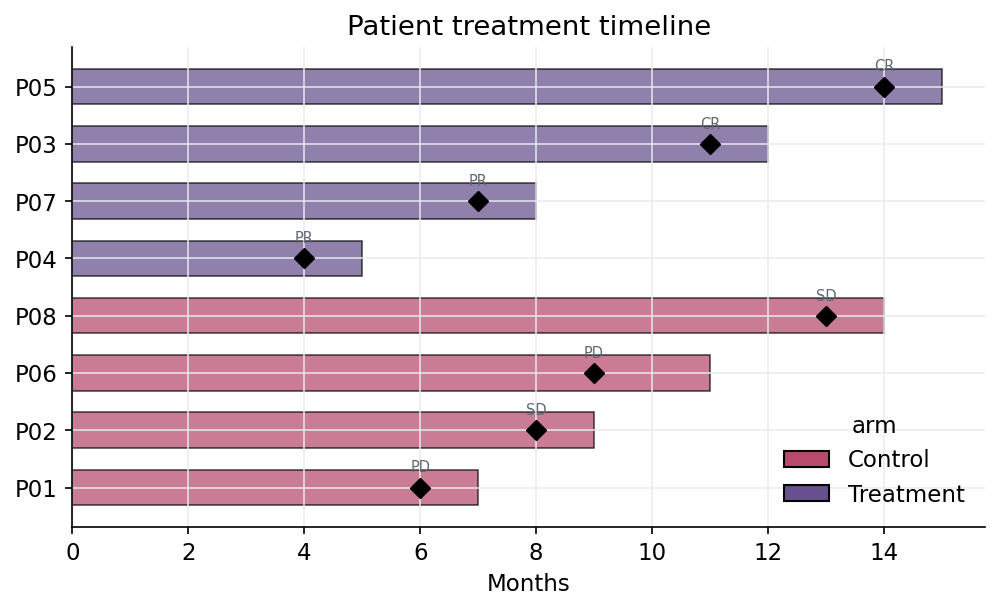
Missingness And Table Summaries
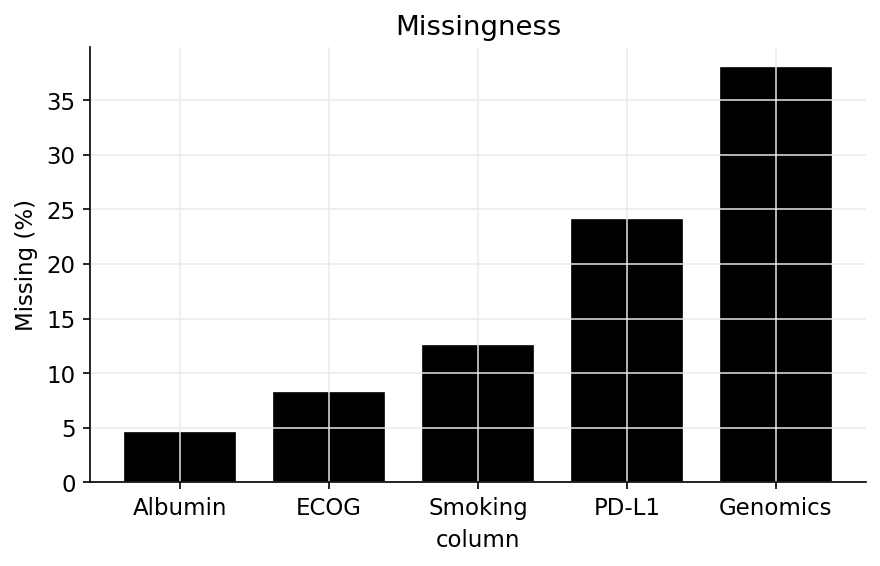
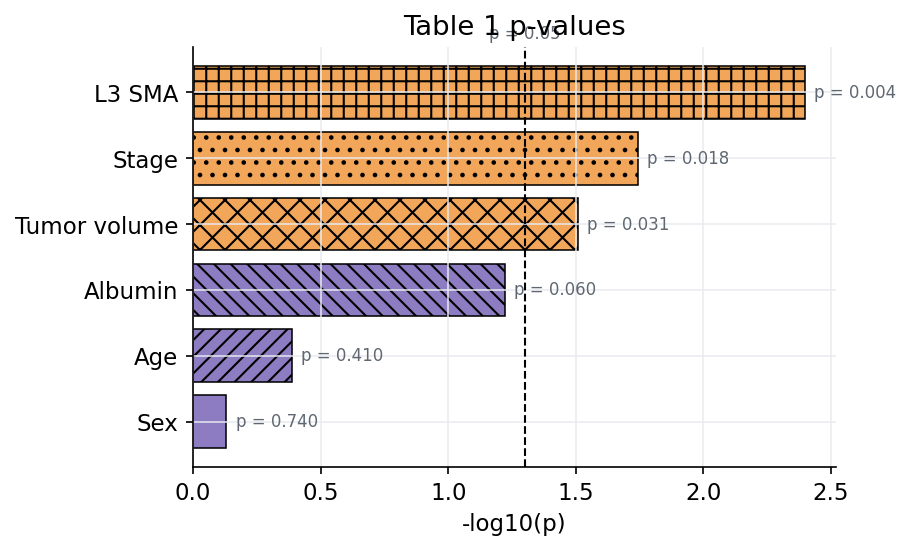
Statistical Annotations
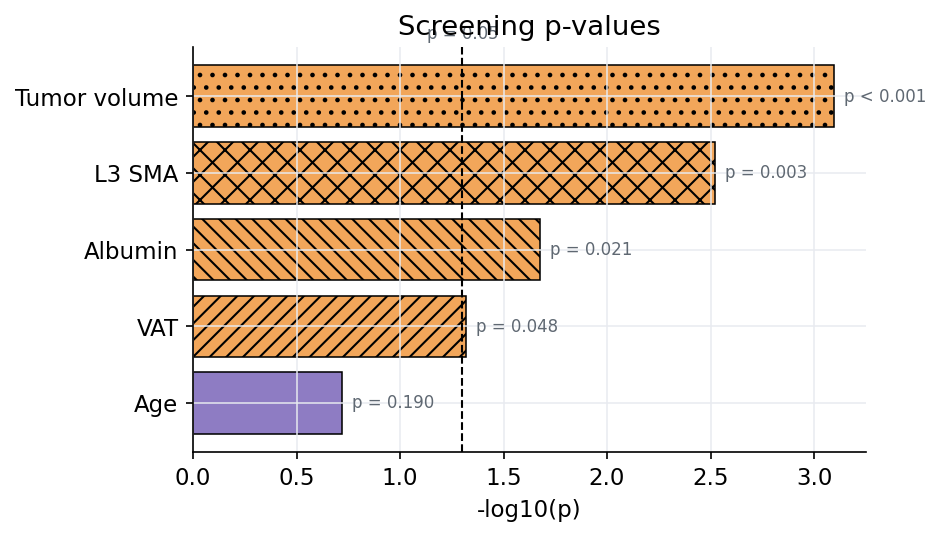
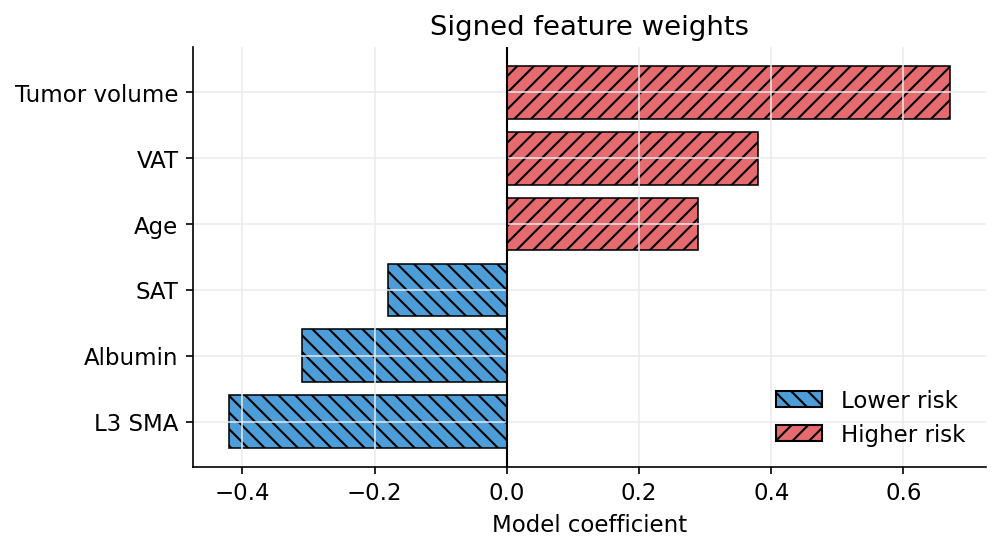
Segmentation QC
Correlation And Cohort QC
Regenerate The Gallery
The gallery assets are generated from code:
uv run python scripts/generate_plot_examples.py
uv run python scripts/build_docs.py
Keep the generated PNGs with the documentation source so the rendered site stays stable across environments.